In this post , let us learn about bar plot in python with example.
Bar plot in python
This helps us to represent the categorical data using rectangular bar with x and y axis.
Codelines
Below are the libraries need to be imported for achieving the graph plotting .
import pandas as pd
from matplotlib import pyplot as plt
a=pd.read_csv('D:\data\shows.csv')
a.head()
Result
The sample file containing nationality details looks like the below.
Age	Experience	Rank	Nationality	Go
0	36	10	9	UK	NO
1	42	12	4	USA	NO
2	23	4	6	N	NO
3	52	4	4	USA	NO
4	43	21	8	USA	YES
Codeline
Country level count can be listed with below syntax.
a['Nationality'].value_counts()Result
UK     5
N      4
USA    4
Name: Nationality, dtype: int64
Codeline
We can try to get only the country names using keys function.
a['Nationality'].value_counts().keys()Result
Index(['UK', 'N', 'USA'], dtype='object')Codeline
The list function groups the various country names.
a['Nationality'].value_counts().keys().tolist()Result
['UK', 'N', 'USA']Codeline
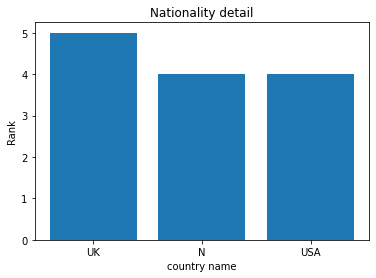
The label option will label the x and y axis accordingly.
plt.bar(a['Nationality'].value_counts().keys().tolist(),a['Nationality'].value_counts().tolist())
plt.xlabel("country name")
plt.ylabel("Rank")
plt.title("Nationality detail")
Result